
What is Intraday trading (Day trading)?
Intraday trading, or more known to many as day trading is the act of buying and selling securities within the market’s trading day. Most of these transactions are short-term. Trades can last from a few minutes up until the market’s daily closing hour. The main take of intraday trading is that it cannot last overnight or beyond market hours.
Many traders are familiar with this type of trading, being the most common and arguably most profitable. Since most transactions are short-term, this allows the trader to bulk up on small profits within the day’s trading. This causes the market to be more volatile, albeit already volatile, and traders take advantage of the fluctuating prices. The trading principle that day traders follow is investing in numerous short-term trades to gain small, quick profits that translate to a large gain overall.
Relative Strength Index (RSI) Indicator on Intraday Trading
The main function of the RSI Indicator is to measure the speed and change of the recent price movements. It identifies bullish and bearish market trends within short market periods.
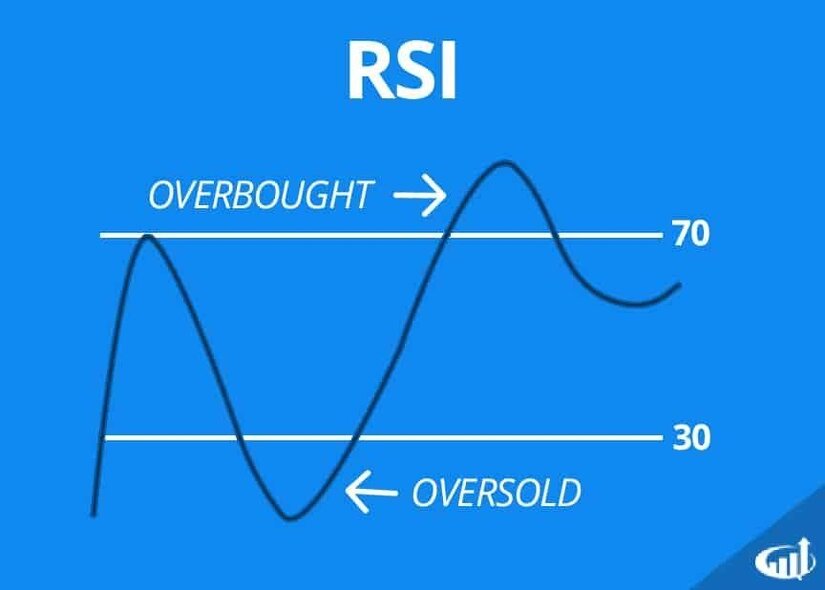
The RSI uses two critical levels that indicate an asset’s buy and sell signals. These two levels or lines are the -70 and the -30 level.
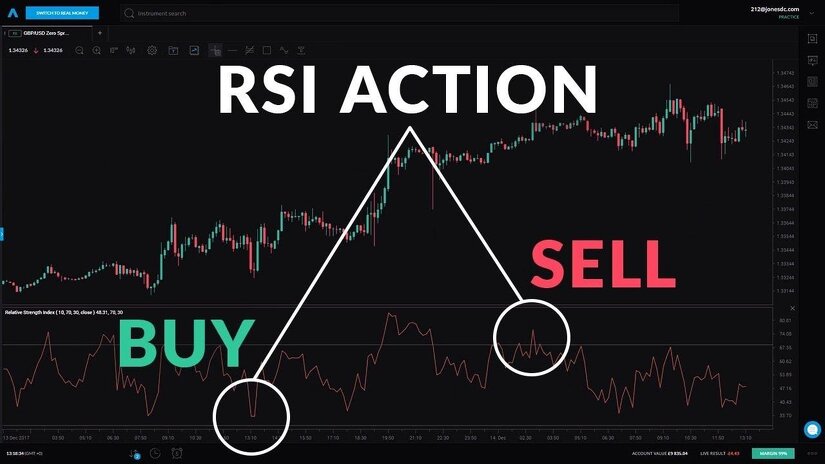
The -70 line indicates an overbought level, while the -30 indicates an oversold level. Traders base their trading decisions on these two levels when day trading. The overbought level means that the price of the asset has gone over to the extreme boundaries of the price range, therefore indicating that a price reversal is about to happen. With this information indicated by the RSI, traders will take a sell position just as the price breaks out of the -70 line and before it bounces to a fall.
The oversold level indicates a potential breakout in the price movement under the -30 line, therefore signaling that the price will soon climb back again. As the RSI indicates that the price has dipped under the -30 level, traders will take a long position just before the price starts rising again.
Conclusion
The RSI Indicator may be the most effective indicator to use when intraday trading. It follows price movements closely: can identify bull and bear trends, determine breakouts and price reversals, and indicate the most recent price changes. It gives both buys and sells signals that the trader can use in carrying out short-term trades. It is also very easy and efficient when applied to the chart as it only follows two identifiers of trading signals, which are the -70 and -30 line. The reason why it fits intraday trading perfectly is that it can keep up with quick price changes and suggest which trading position to take. All these within a short time. With a simple interface, even the most amateur trader can follow the RSI Indicator. Profits are almost a guarantee.
Read more:
Top 5 most accurate intraday trading indicators
Intraday Trading – Trading Channels
Intraday Trading – moving average indicator